Monitoring a Raspberry Pi Running Multiple Services
If your Raspberry Pi 4 is acting as a lightweight home server running services like Pi-hole, Jellyfin, OpenVPN, and Samba, regular health checks are important for long-term stability. The good news is that you do not need a GUI or heavy monitoring suite to keep tabs on the system.
A handful of terminal commands can quickly tell you whether your Pi is healthy, overheating, throttling, running out of storage, or experiencing service failures.
Recommended Command Order
When troubleshooting or checking overall health, run these commands in the following order. This sequence starts with hardware-level issues before moving into software and service diagnostics.
1. Check for Power Issues and CPU Throttling
Under-voltage is one of the most common Raspberry Pi stability problems. Weak power delivery can cause silent corruption, instability, poor performance, and random crashes.
vcgencmd get_throttledHealthy output:
throttled=0x0Any other value indicates current or historical throttling caused by under-voltage or overheating.
If you see values like:
0x50000
0x50005
your Pi has experienced throttling events and your power supply or cooling should be investigated.
For Raspberry Pi 4 systems running multiple services, the official Raspberry Pi power supply is strongly recommended.
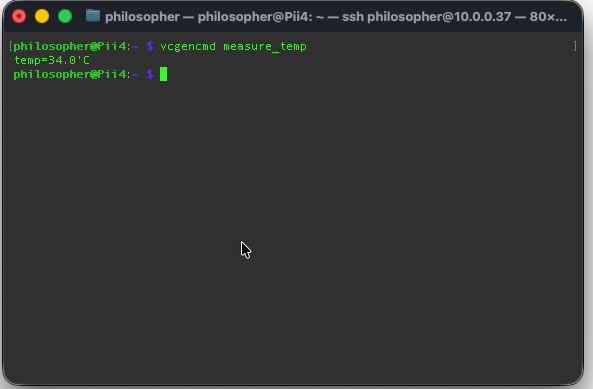
2. Check CPU Temperature
Jellyfin transcoding and Samba transfers can place sustained load on the CPU. Excess heat eventually causes thermal throttling.
vcgencmd measure_tempExample output:
temp=51.2'CGeneral temperature guidelines:
- Under 60°C: Excellent
- 60°C–70°C: Acceptable under load
- 70°C–80°C: Getting warm
- Over 80°C: Thermal throttling begins
If temperatures regularly climb above 80°C, consider adding a heatsink, fan, or improving case airflow.
3. Check CPU Usage, Load, and Memory
The best all-in-one terminal monitoring tool for a headless Raspberry Pi is htop.
Install it:
sudo apt install htopRun it:
htopInside htop, monitor:
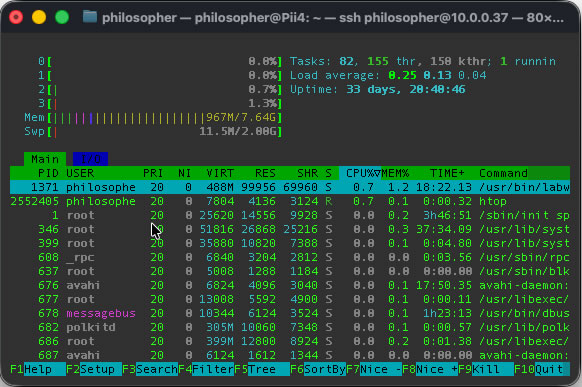
- CPU usage across all cores
- Memory consumption
- Swap usage
- Processes consuming excessive resources
- I/O wait percentages
Many users focus too heavily on RAM usage, but on an 8 GB Raspberry Pi 4, memory is rarely the bottleneck for Pi-hole, Jellyfin, OpenVPN, and Samba combined.
Linux also aggressively caches unused RAM for performance improvements, so the more important metric is available memory rather than free memory.
To check memory allocation more directly:
free -h
Pay close attention to the available column rather than only free.
4. Check Storage Usage
A nearly full drive can cause service failures, database corruption, logging problems, and poor overall performance.
df -h
Look at the Use% column for your root filesystem.
- Below 80%: Healthy
- 80%–90%: Monitor closely
- Over 90%: Clean up space immediately
Jellyfin metadata, Samba shares, logs, and cached files can consume storage faster than expected.
5. Check for SD Card or Disk Errors
MicroSD cards wear out over time, especially under heavy write workloads.
Check kernel logs for storage-related errors:
sudo dmesg -l err,critWatch for messages containing:
I/O errormmcblk0EXT4-fs error
These often indicate a failing SD card or unstable storage device.
If your Raspberry Pi is serving media through Jellyfin or handling constant Samba writes, booting from an SSD instead of a MicroSD card can significantly improve reliability and performance.
6. Verify Service Statuses
Once hardware checks look healthy, verify that your services are running properly.
sudo systemctl is-active pihole-FTL jellyfin openvpn smbdHealthy output:
active
active
active
active
If a service reports:
inactivefaileddegraded
inspect the logs for that service:
sudo journalctl -u jellyfin -n 50
Replace jellyfin with the appropriate service name as needed.
Understanding Jellyfin Resource Usage
One common surprise for Raspberry Pi 4 owners is that Jellyfin often uses very little RAM even while serving media.
This is normal.
Direct-play streaming uses minimal resources. The heavy workload begins when Jellyfin needs to transcode video into another format or bitrate.
During transcoding, CPU usage will spike dramatically while RAM usage may remain relatively low.
On most Raspberry Pi systems, CPU performance and storage speed become bottlenecks long before memory capacity does.
Properly Exiting htop
To exit htop cleanly:
qor:
F10
While Ctrl+C will also terminate htop, it can occasionally leave terminal formatting looking messy.
If your terminal becomes visually corrupted afterward, run:
clearor:
resetA Simple Raspberry Pi Health Checklist
For quick daily or weekly checks, this sequence works well:
vcgencmd get_throttled
vcgencmd measure_temp
free -h
htop
df -h
sudo dmesg -l err,crit
sudo systemctl is-active pihole-FTL jellyfin openvpn smbd
Running through these commands regularly provides a fast overview of your Raspberry Pi’s hardware health, storage integrity, thermal status, and service stability.